4 Single-Cell Trees
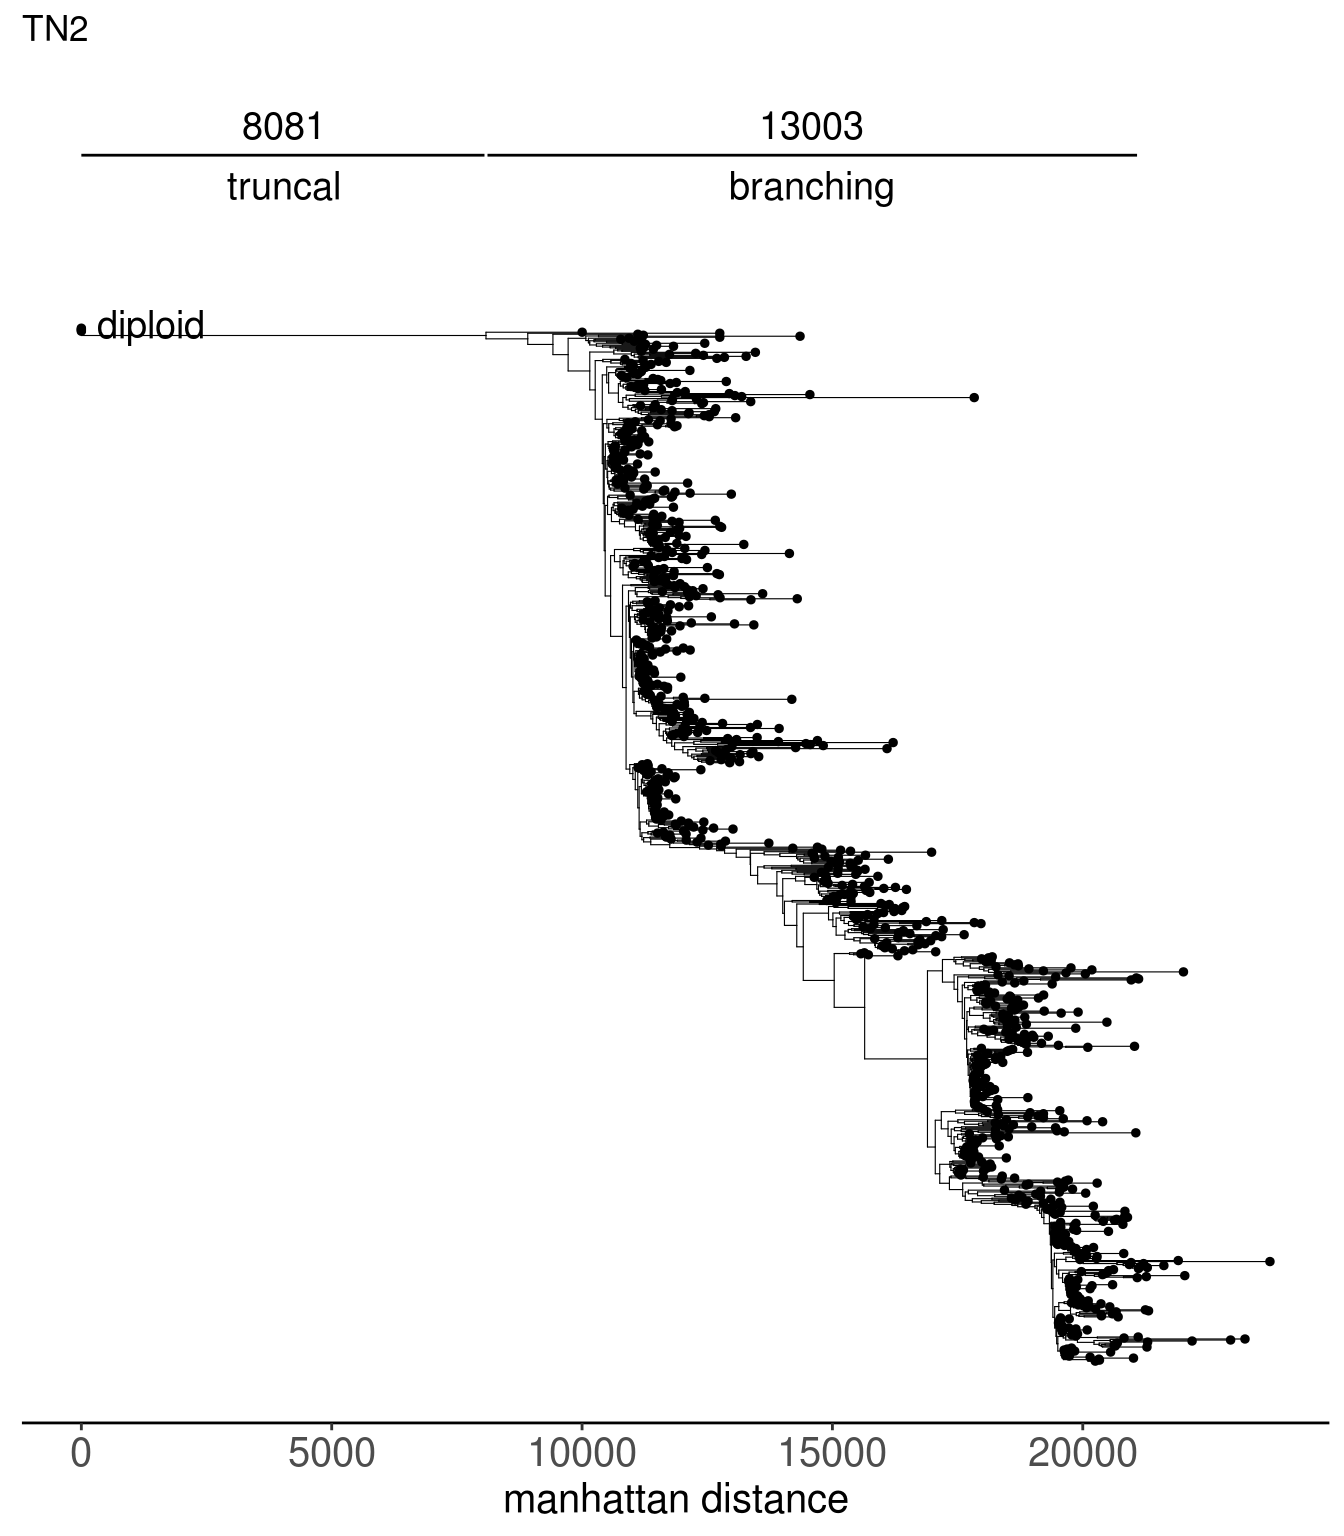
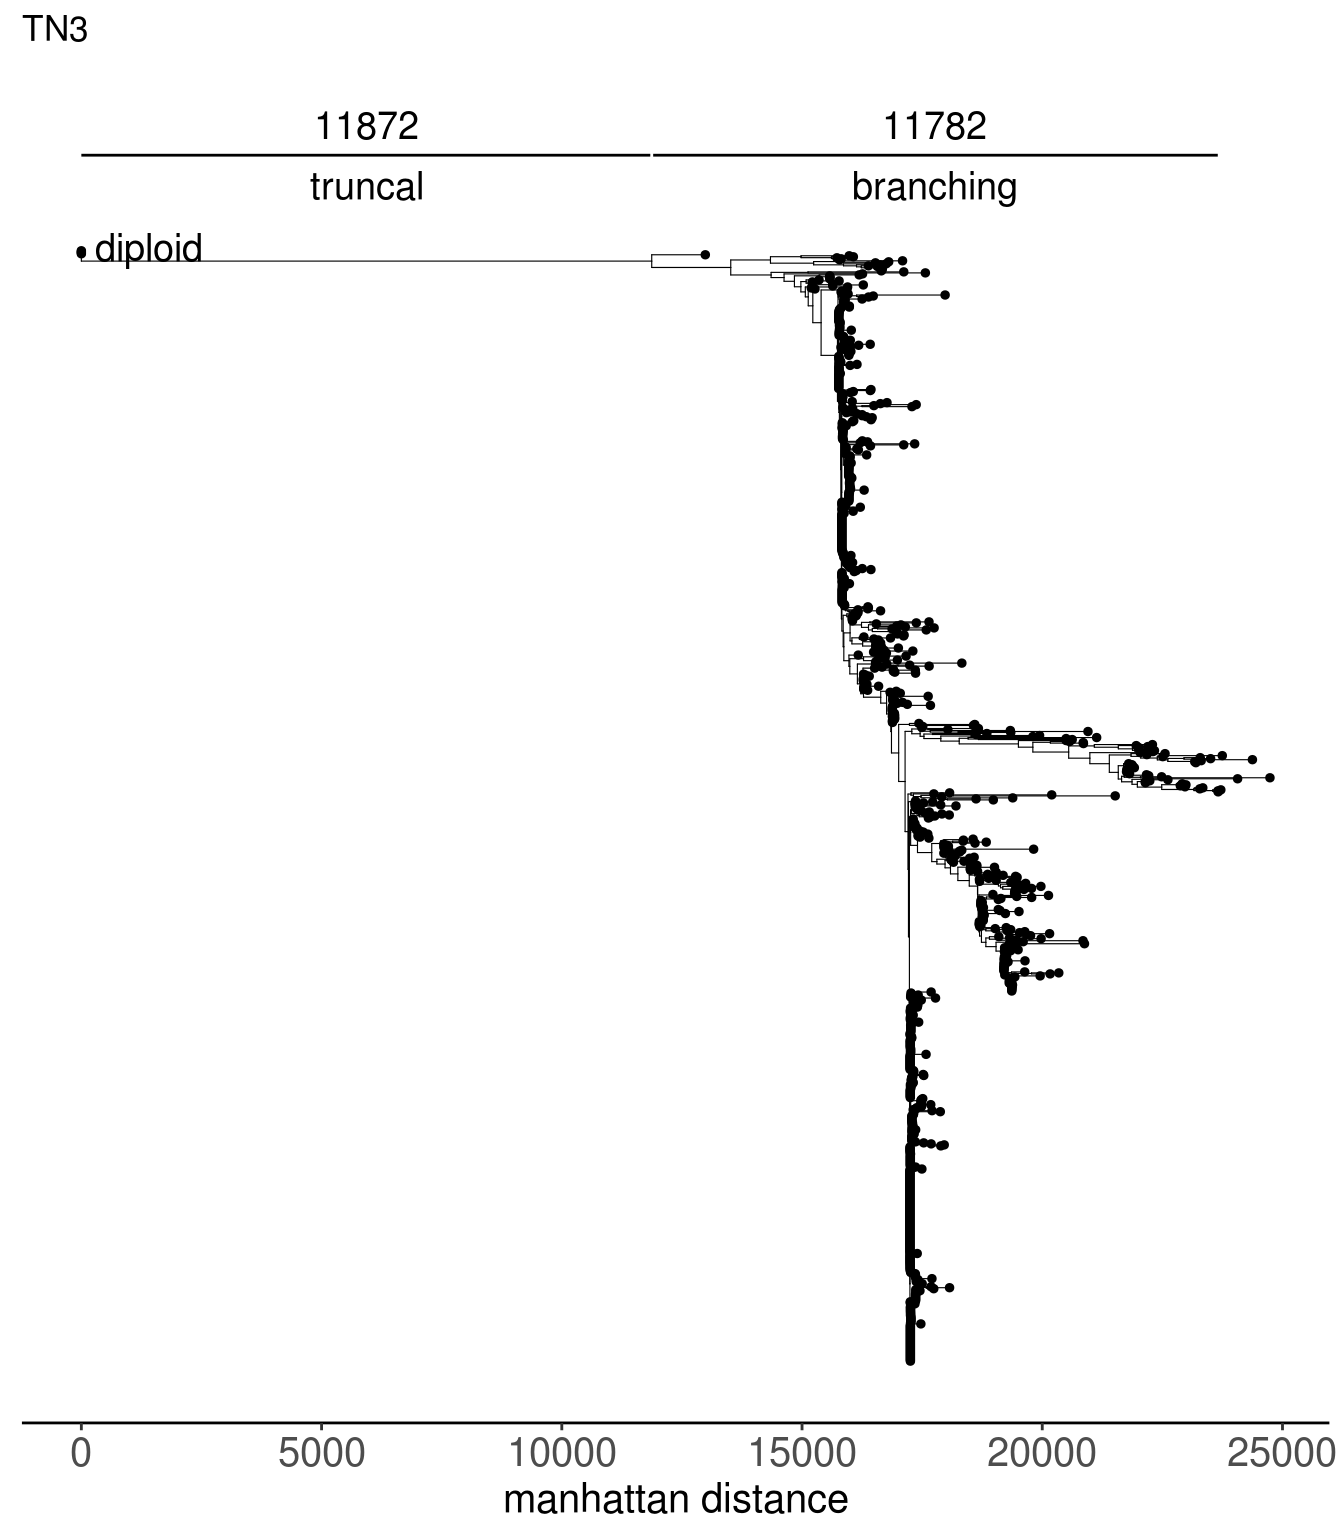
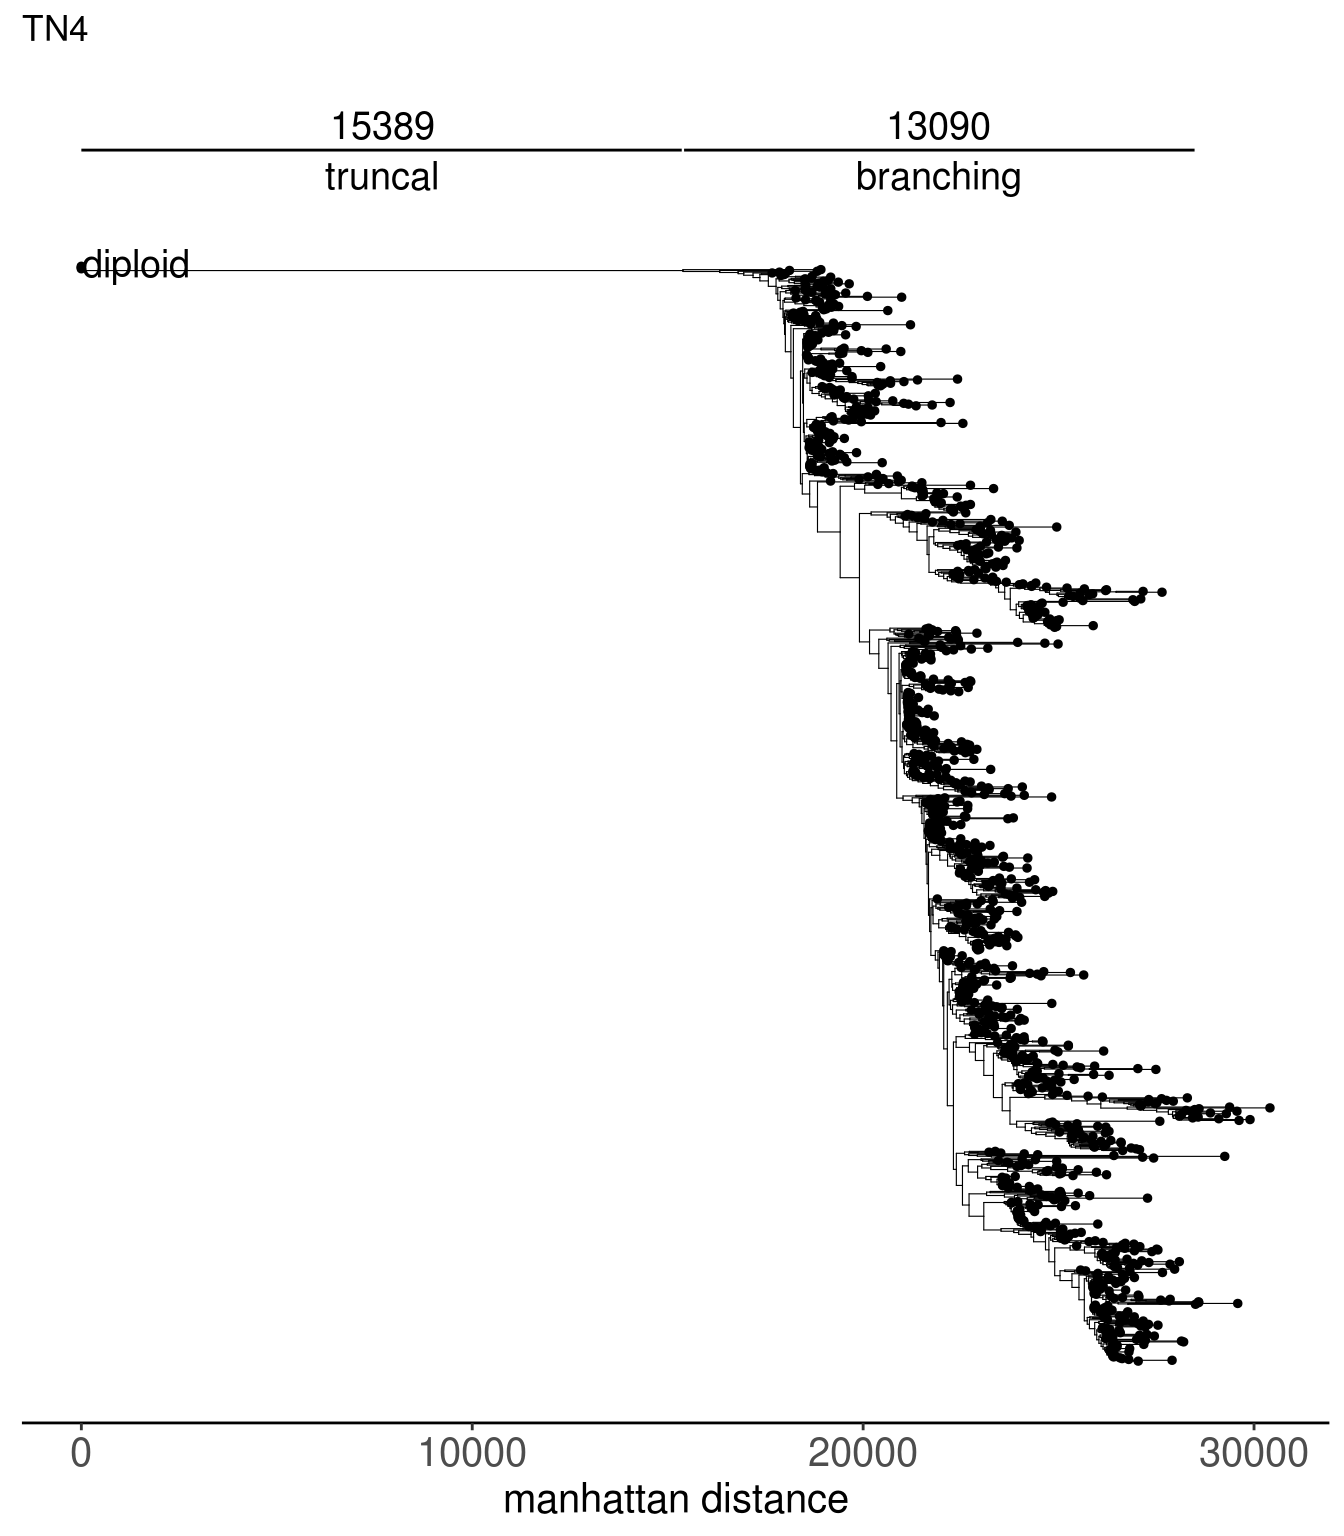
Function used to generate the trees using ape::fastme.bal() is make_single_cell_tree. Trees generated from the following function are provided in the directory extdata/trees
make_single_cell_tree <- function(tumor_log_segratio,
                                  ploidy_VAL_diploid = 2,
                                  tumor_ploidy_VAL,
                                  tree_fun = "fastme.bal",
                                  dist_metric = "manhattan") {

  '%!in%' <- function(x,y)!('%in%'(x,y))

  if (tree_fun %!in% c("nj", "fastme.bal")) {
    stop("Please input a valid tree function. Accepted values are 'nj' or 'fastme.bal'")
  }

  normal_long <- tibble(
    C1 = rep.int(1e-3, nrow(tumor_log_segratio)),
    C2 = rep.int(1e-3, nrow(tumor_log_segratio)),
    C3 = rep.int(1e-3, nrow(tumor_log_segratio)),
    C4 = rep.int(1e-3, nrow(tumor_log_segratio))
  )
  normal_long <- as.data.frame(t(normal_long))
  n_ploidy <- ploidy_scale(ploidy_VAL_diploid, normal_long)
  rownames(n_ploidy) <- rownames(normal_long)

  # tumor_long <- create_popseg_long(popseg_tumor) # tumor cells only
  t_ploidy <- ploidy_scale(tumor_ploidy_VAL, tumor_log_segratio)

    # combining normal and tumor cells
  combined <- rbind(n_ploidy, t_ploidy)

  if (tree_fun == "nj") {
    tree <- ape::nj(amap::Dist(combined, method=dist_metric, nbproc = 40))
    return(tree)
  }

  if (tree_fun == "fastme.bal") {
    tree <- ape::fastme.bal(amap::Dist(combined, method=dist_metric, nbproc = 40))
    return(tree)
  }

}
tn1_tree <- read.tree(here("extdata/trees/tn1_sc_tree.tree"))
tn2_tree <- read.tree(here("extdata/trees/tn2_sc_tree.tree"))
tn3_tree <- read.tree(here("extdata/trees/tn3_sc_tree.tree"))
tn4_tree <- read.tree(here("extdata/trees/tn4_sc_tree.tree"))
tn5_tree <- read.tree(here("extdata/trees/tn5_sc_tree.tree"))
tn6_tree <- read.tree(here("extdata/trees/tn6_sc_tree.tree"))
tn7_tree <- read.tree(here("extdata/trees/tn7_sc_tree.tree"))
tn8_tree <- read.tree(here("extdata/trees/tn8_sc_tree.tree"))
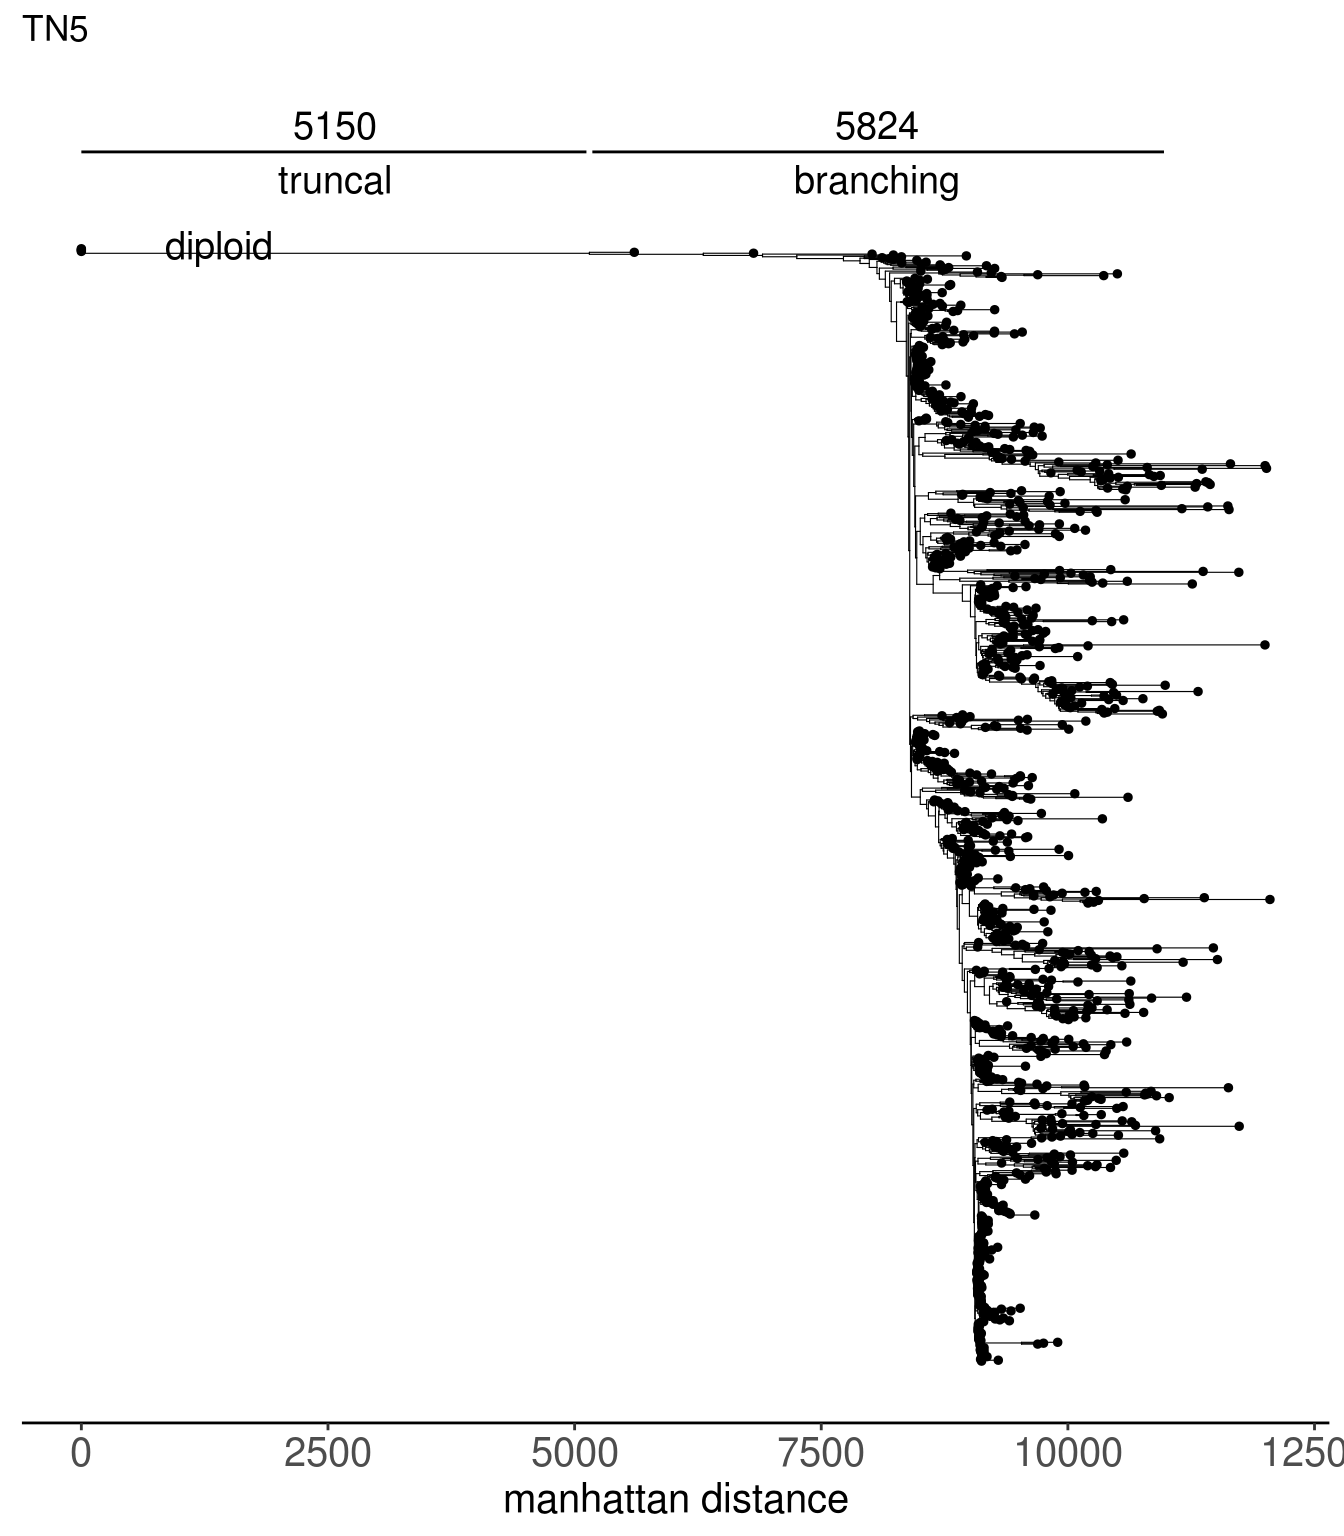
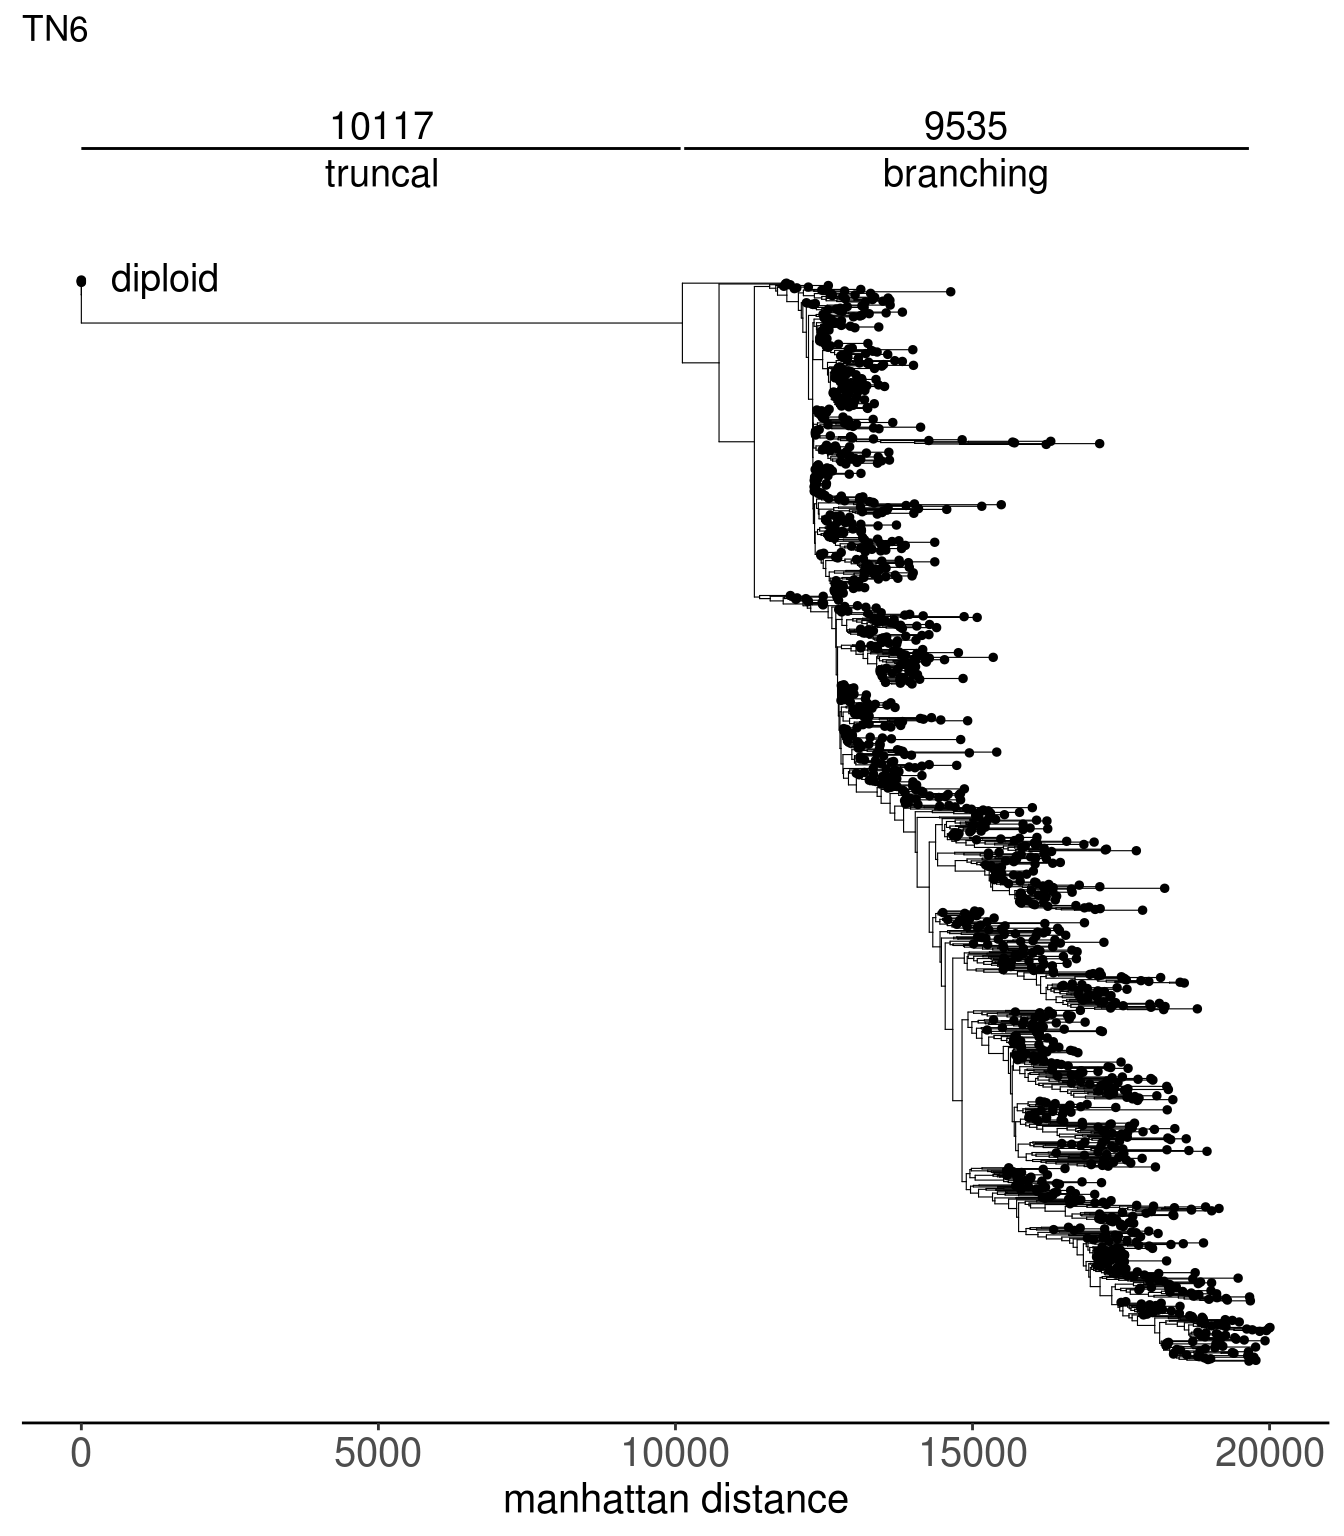

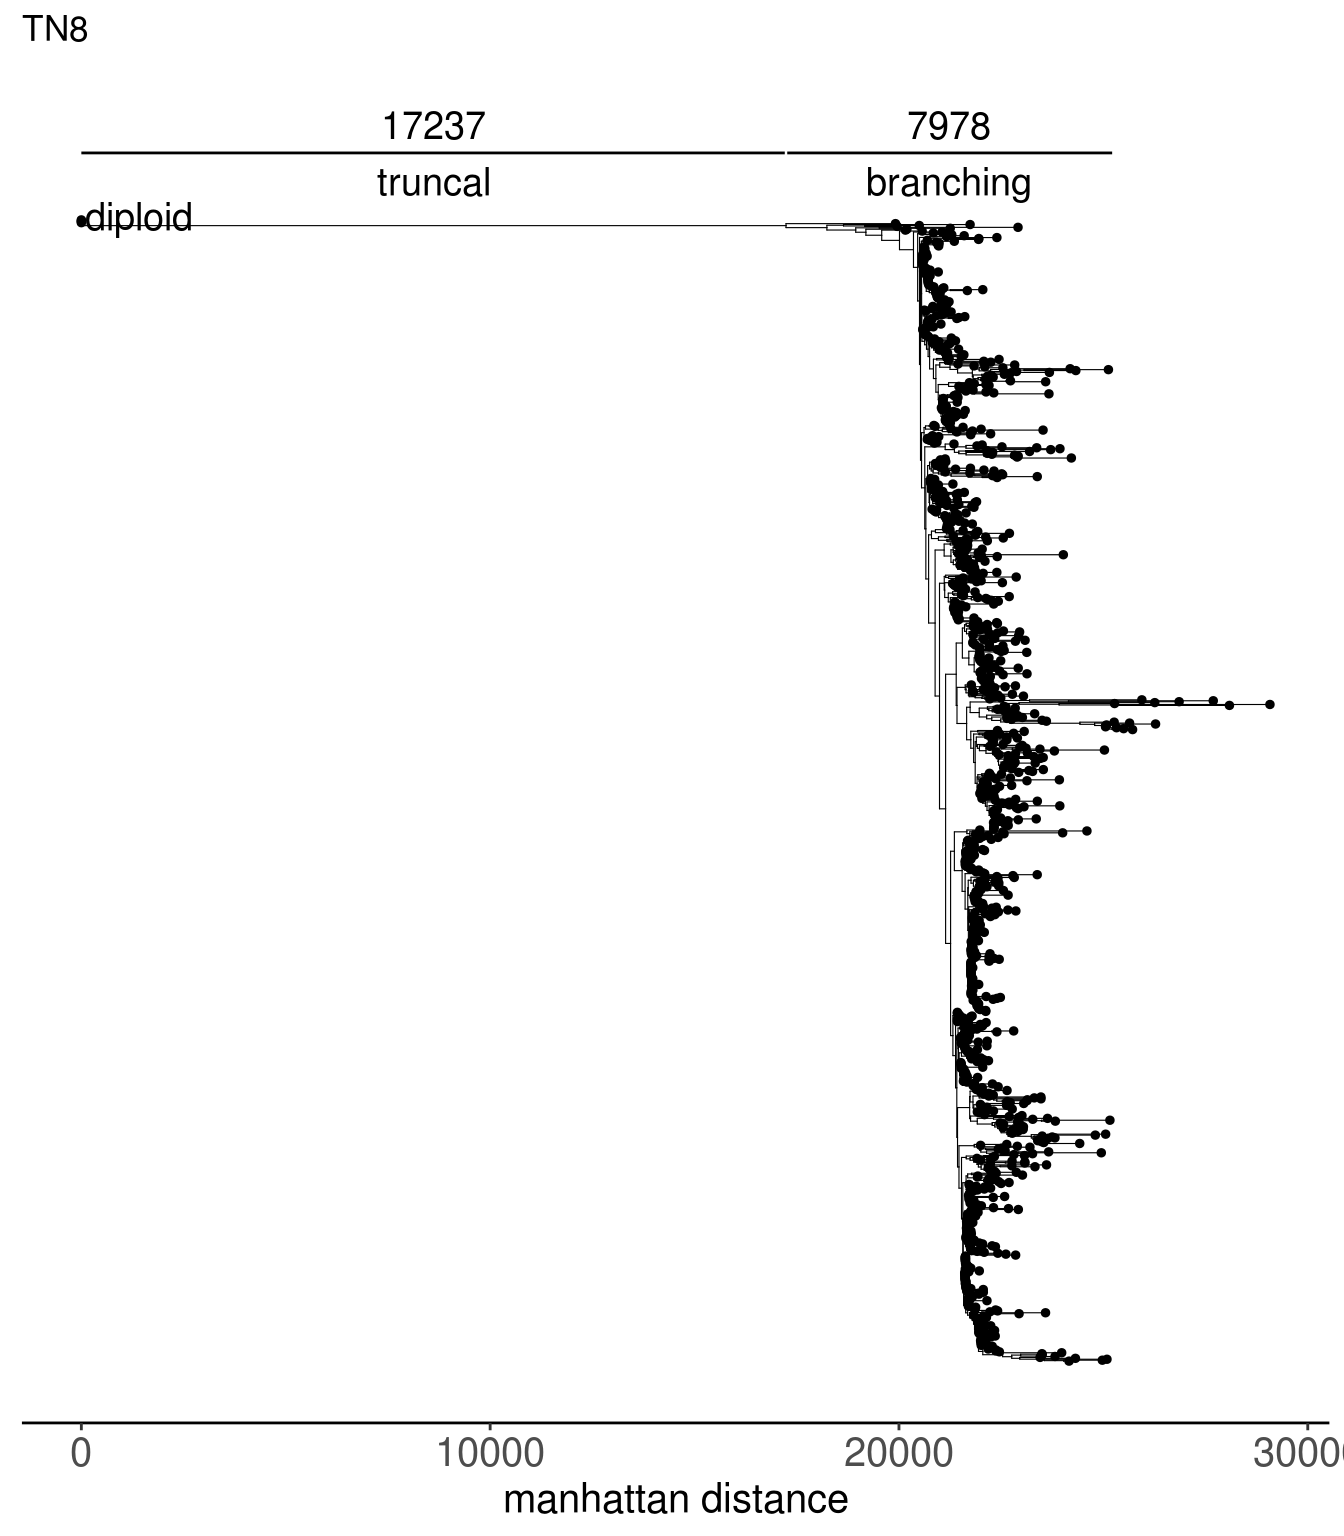
tn1_dist_nodes <- calc_sctree_dists(tn1_tree) %>% mutate(sample = "TN1")
tn2_dist_nodes <- calc_sctree_dists(tn2_tree) %>% mutate(sample = "TN2")
tn3_dist_nodes <- calc_sctree_dists(tn3_tree) %>% mutate(sample = "TN3")
tn4_dist_nodes <- calc_sctree_dists(tn4_tree) %>% mutate(sample = "TN4")
tn5_dist_nodes <- calc_sctree_dists(tn5_tree) %>% mutate(sample = "TN5")
tn6_dist_nodes <- calc_sctree_dists(tn6_tree) %>% mutate(sample = "TN6")
tn7_dist_nodes <- calc_sctree_dists(tn7_tree) %>% mutate(sample = "TN7")
tn8_dist_nodes <- calc_sctree_dists(tn8_tree) %>% mutate(sample = "TN8")

tumors_dist_nodes <- bind_rows(
  tn1_dist_nodes,
  tn2_dist_nodes,
  tn3_dist_nodes,
  tn4_dist_nodes,
  tn5_dist_nodes,
  tn6_dist_nodes,
  tn7_dist_nodes,
  tn8_dist_nodes
)

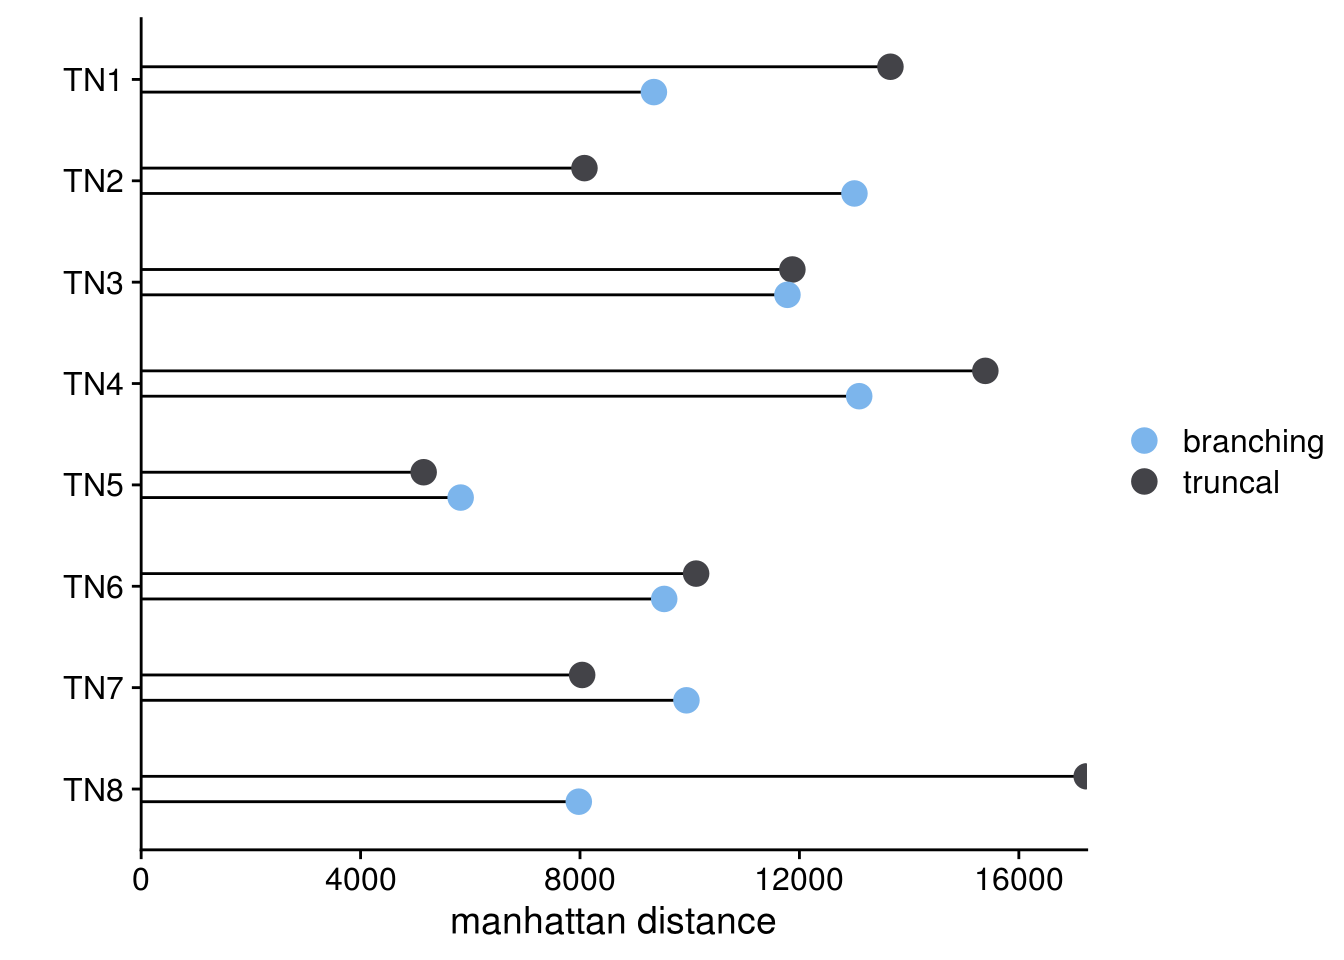
sc_trees_dist_plots <- tumors_dist_nodes %>%
  gather(key = "evolution",
         value = "manhattan_dist",
         -sample,
         -truncal_node) %>%
  ggplot(aes(y = manhattan_dist,
                 x = fct_relevel(sample, rev(gtools::mixedsort(tumors_dist_nodes$sample))))) +
  geom_linerange(aes(ymin = 0, ymax = manhattan_dist, group = evolution),
                 position = position_dodge(width = .5)) +
  geom_point(aes(color = evolution,
             group = evolution),
             position = position_dodge(width = .5),
             size = 4) +
  coord_flip() +
  scale_y_continuous(expand = c(0,0)) +
  scale_color_paletteer_d("ggthemes::hc_default") +
  labs(y = "manhattan distance",
       color = "",
       x = "") +
  theme_cowplot()

sc_trees_dist_plots