8 MDA-231 DNA & RNA
Transcript abundances for expanded clones triplicates were quantified by Salmon (v.0.14) with GENCODE transcript v30 and options -l A -1 read1 -2 read2 -p 40 –validateMappings –seqBias –gcBias. Quantified transcripts were imported into R with ‘tximport’ (v 1.14). Expanded clones e7, e39 and e71 had one technical replicate excluded due to poor RNA quality
source("R/setup.R")
source("R/run_umap.R")
source("R/run_clustering.R")
source("R/order_dataset.R")
source("R/plot_umap.R")
source("R/calculate_consensus.R")
source("R/consensus_genomic_classes.R")
source("R/run_me_tree.R")
source("R/plot_heatmap.R")
source("R/plot_moving_averages.R")
# ~~~~~~~~~~~~~~~~~~~~~~~~~~~~~~~~~~~ Sat Mar 6 17:34:47 2021
# RNA
# ~~~~~~~~~~~~~~~~~~~~~~~~~~~~~~~~~~~ Sat Mar 6 17:34:51 2021
# reading RNA data
dds <- readRDS(here("extdata/rna/mdamb231_rna_dds.rds"))
# Quality filtering
keep <- rowSums(counts(dds) >= 5) >= 3
dds <- dds[keep,]
# computation of size factors which normalize for
# differences in sequencing depth among samples
dds <- estimateSizeFactors(dds)## using 'avgTxLength' from assays(dds), correcting for library size
# variance-stabilizing transformation
vsd <- vst(dds)

# ~~~~~~~~~~~~~~~~~~~~~~~~~~~~~~~~~~~ Sat Mar  6 17:34:56 2021
# DNA
# ~~~~~~~~~~~~~~~~~~~~~~~~~~~~~~~~~~~ Sat Mar  6 17:35:01 2021

mda_ploidy <- 2.41

# data from DNA bulk expanded clones
# and from mda-mb-231 single-cell were merged to the same dataframe

mdamb231_sc_bulk_cna_popseg <- readRDS(here("extdata/popseg/mdamb231_sc_bulk_cna_popseg.rds"))
mdamb231_sc_bulk_cna_ml <- readRDS(here("extdata/merge_levels/mdamb231_sc_bulk_cna_ml.rds"))
8.1 Co-clustering
## Constructing UMAP embedding.mdamb231_sc_bulk_clustering <- run_clustering(mdamb231_sc_bulk_umap,
k_snn_major = 43,
k_snn_minor = 14) ## Building SNN graph.## Running hdbscan.## cluster n percent
## c1 176 0.19599109
## c10 203 0.22605791
## c11 36 0.04008909
## c12 14 0.01559020
## c13 197 0.21937639
## c2 28 0.03118040
## c3 59 0.06570156
## c4 52 0.05790646
## c5 32 0.03563474
## c6 42 0.04677060
## c7 20 0.02227171
## c8 16 0.01781737
## c9 23 0.02561247## Done.mdamb231_sc_bulk_clustering_umap <- left_join(mdamb231_sc_bulk_umap,
mdamb231_sc_bulk_clustering,
by = c("cell" = "cells"))
mdamb231_sc_bulk_clustering_umap <- mdamb231_sc_bulk_clustering_umap %>%
mutate(
type = case_when(str_detect(cell, "gDNA") ~ "bulk",
TRUE ~ subclones),
shape = case_when(str_detect(cell, "gDNA") ~ 8,
TRUE ~ 20),
size = case_when(str_detect(cell, "gDNA") ~ 1.2,
TRUE ~ 1),
)
p1 <- mdamb231_sc_bulk_clustering_umap %>% arrange(desc(type)) %>%
ggplot() +
geom_point(aes(V1,V2, color = superclones), size = 6) +
geom_point(aes(V1,V2, color = type, shape = shape, size = size), stroke = 1.5) +
scale_color_manual(values = c(colors_vector$superclones, colors_vector$subclones, "bulk" = "black")) +
scale_shape_identity() +
scale_size_identity() +
theme_classic() +
theme(axis.title.x=element_text(colour = "gray50", size = 20),
axis.text.x= element_blank(),
axis.ticks.x=element_blank(),
axis.title.y = element_text(colour = "gray50", size = 20),
axis.text.y = element_blank(),
axis.ticks.y = element_blank(),
axis.line = element_blank(),
legend.position = "none",
panel.border = element_rect(color = "black",
fill = NA,
size = 2),
# legend.position = "null"
) +
labs(color = "") +
xlab("umap1") +
ylab("umap2")
p1
# this setup will be used to plot the heatmap later

mda_ordered <- order_dataset(popseg_long = mdamb231_sc_bulk_cna_ml,
                             clustering = mdamb231_sc_bulk_clustering)

mda_cocluster_consensus <- calculate_consensus(df = mda_ordered$dataset_ordered,
                                     clusters = mda_ordered$clustering_ordered$subclones)

mda_cocluster_me_tree <- run_me_tree(consensus_df = mda_cocluster_consensus,
                                     clusters = mdamb231_sc_bulk_clustering,
                                     ploidy_VAL = mda_ploidy)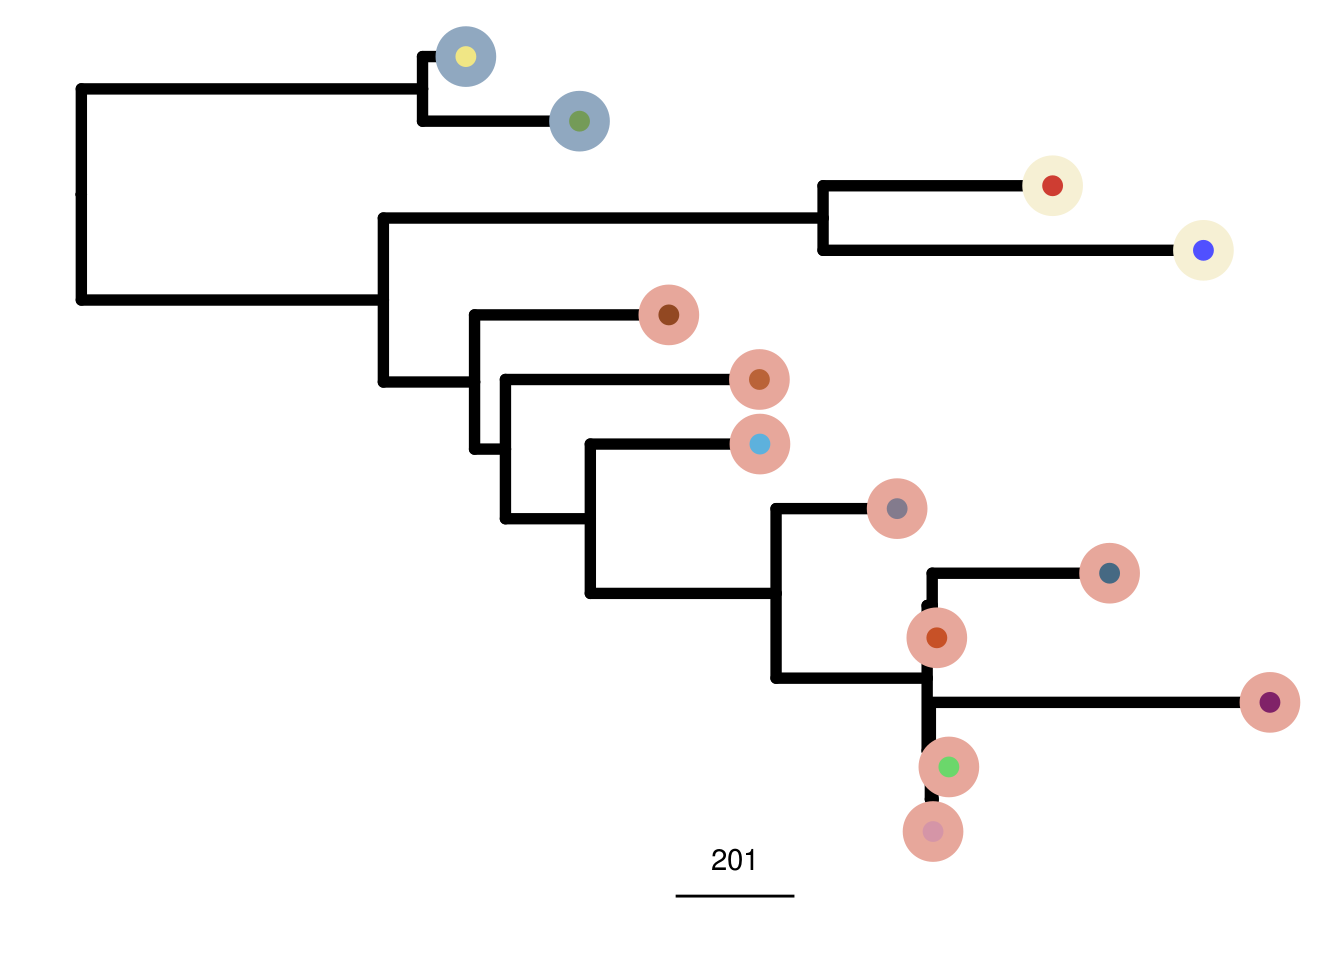
8.2 Single-cell + Bulk Heatmap
plot_heatmap(df = mda_ordered$dataset_ordered,
             ploidy_VAL = mda_ploidy,
             ploidy_trunc = 2*(round(mda_ploidy))+2,
             clusters = mda_ordered$clustering_ordered,
             genomic_classes = NULL,
             keep_gene = NULL,
             tree_order = mda_cocluster_me_tree$cs_tree_order,
             show_legend = TRUE,
             mda_cocluster = TRUE)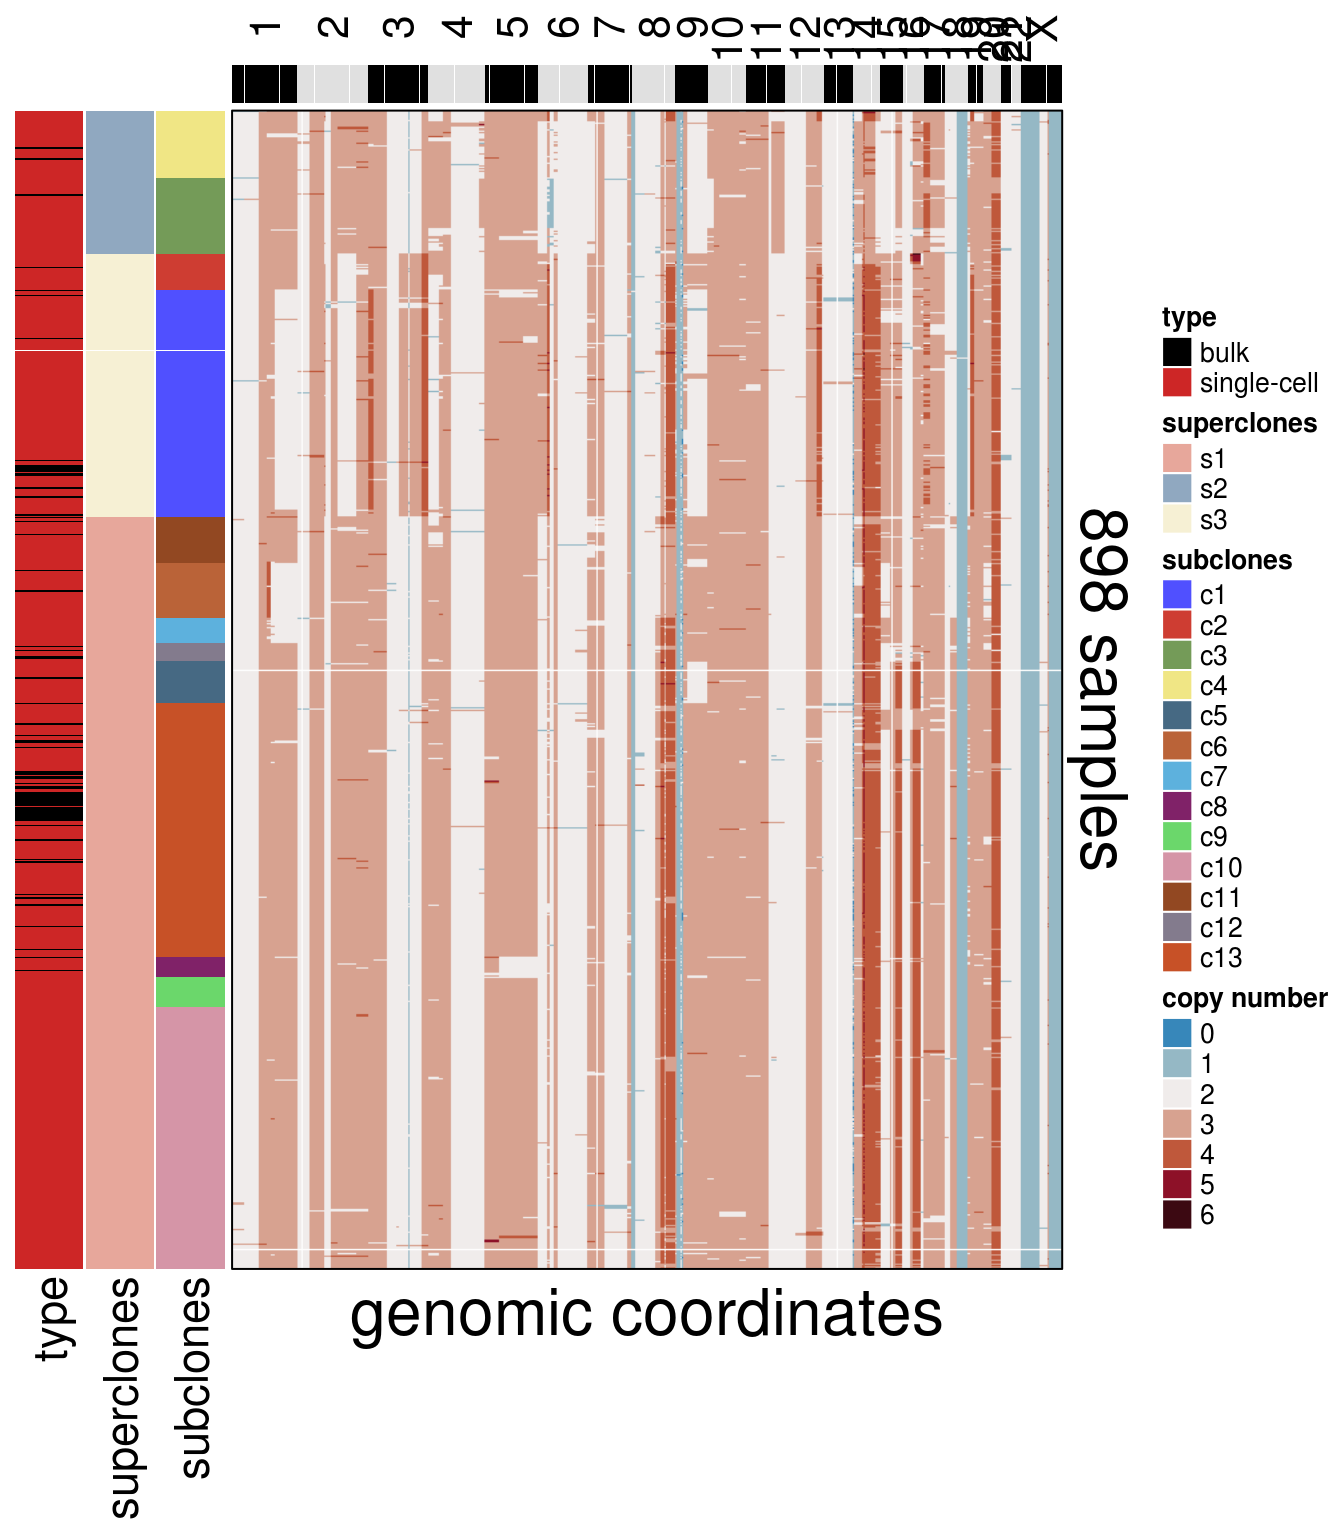
8.3 Bulk Heatmap
mdamb231_bulk_cna_long <- mda_ordered$dataset_ordered[str_detect(rownames(mda_ordered$dataset_ordered), "gDNA"),]

# clustering info
mdamb231_bulk_cl_info <- mda_ordered$clustering_ordered %>%
  filter(str_detect(cells, "gDNA")) %>%
  arrange(superclones, subclones)

# matching order
mdamb231_bulk_ordered <- mdamb231_bulk_cna_long[mdamb231_bulk_cl_info$cells,]

plot_heatmap(df = mdamb231_bulk_ordered,
             ploidy_VAL = mda_ploidy,
             ploidy_trunc = 2*(round(mda_ploidy))+2,
             clusters = mdamb231_bulk_cl_info,
             genomic_classes = NULL,
             keep_gene = NULL,
             tree_order = NULL,
             show_legend = TRUE,
             mda_cocluster = TRUE)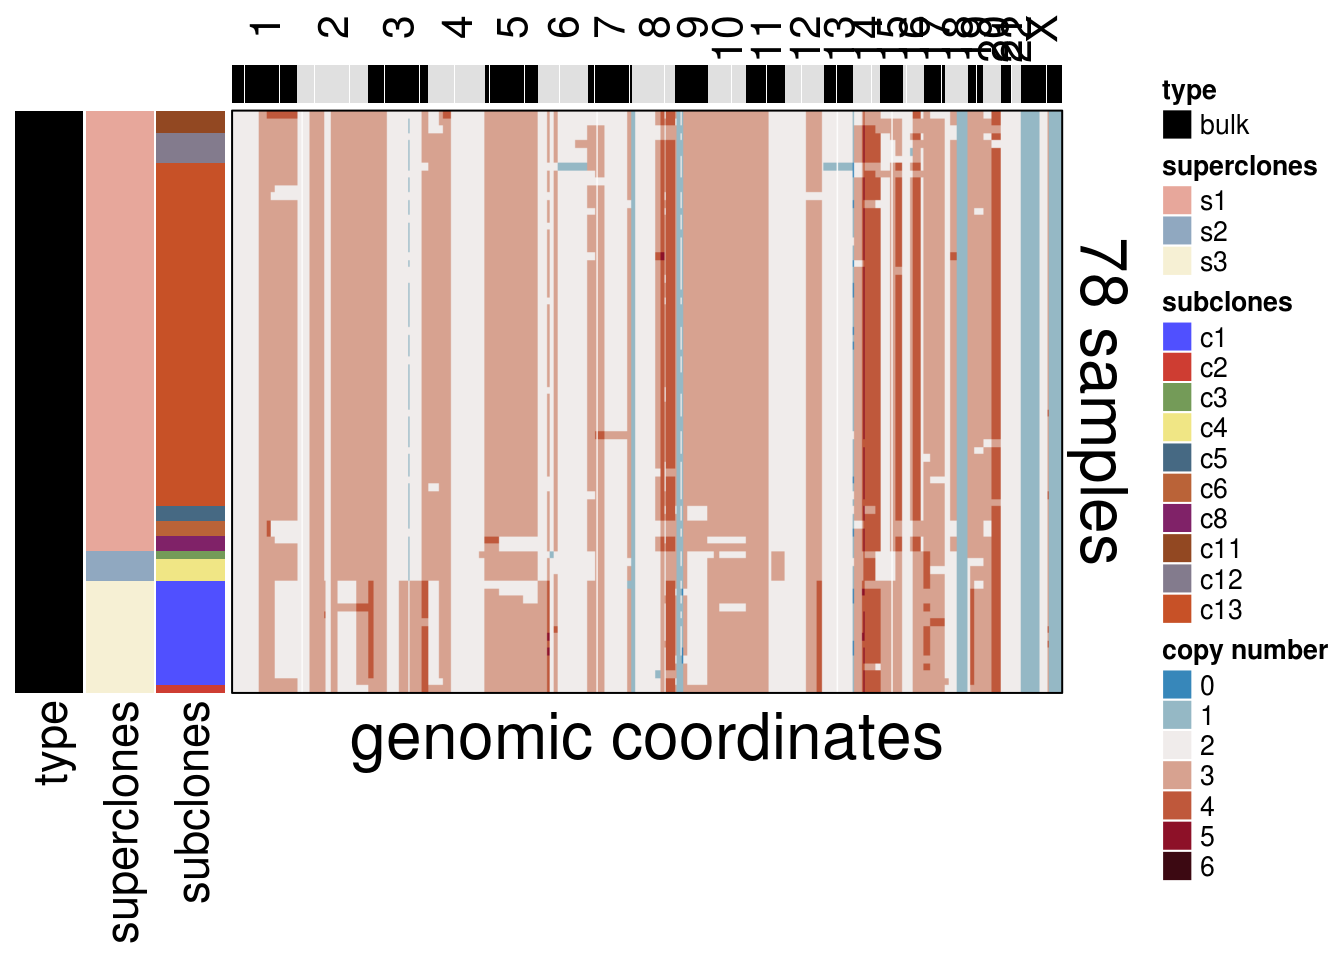
8.4 DNA & RNA
# Biomart
grch37 <-
  useMart(
    biomart = "ENSEMBL_MART_ENSEMBL",
    host = "grch37.ensembl.org",
    path = "/biomart/martservice",
    dataset = "hsapiens_gene_ensembl"
  )

# hg19 chromosome positions from http://hgdownload.cse.ucsc.edu/goldenPath/hg19/bigZips/hg19.chrom.sizes
hg19_chrom_sizes <- readRDS(here("extdata/lib/hg19.chrom.sizes.rds"))

# transforming into a named vector and sorting by chrom
hg19_chrom_sizes <- hg19_chrom_sizes[1:23,]
hg19_chrom_sizes <- deframe(hg19_chrom_sizes)
hg19_chrom_sizes <- hg19_chrom_sizes[gtools::mixedsort(names(hg19_chrom_sizes))]

# obtaining the position for every ensembl gene id
bms <- list()

for(i in 1:length(hg19_chrom_sizes)) {
  chrom <- str_remove(names(hg19_chrom_sizes)[i], "chr")

  if (chrom != "X")
    chrom <- as.numeric(chrom)

  length_chrom <- hg19_chrom_sizes[i]

  bms[[i]] <-
    getBM(
      c(
        "ensembl_gene_id",
        "hgnc_symbol",
        "start_position",
        "end_position"
      ),
      filters = c("chromosome_name", "start", "end"),
      values = list(chrom,
                    0, length_chrom),
      mart = grch37
    )

  bms[[i]] <- bms[[i]] %>% arrange(start_position)

  names(bms)[[i]] <- names(hg19_chrom_sizes)[i]
}

bms_df <- bind_rows(bms, .id = "chr") %>%
  dplyr::rename(gene = "hgnc_symbol",
                gene_id = "ensembl_gene_id")

# obtaining the count matrix of the MDAMB231 bulk RNAseq
cnt <- assay(vsd)

# gene id clean up
rownames(cnt) <- str_extract(rownames(cnt), "[A-Z]+[0-9]+")

# averaging the expression of the RNA triplicates and calculating a zscore
cnt_long <- cnt %>%
  as.data.frame() %>%
  tibble::rownames_to_column("gene_id") %>%
  tidyr::gather(key = "sample",
                value = "count",
                -gene_id) %>%
  mutate(sample = str_remove(sample, "[A-C]$"))

cnt_long_avg <- cnt_long %>%
  group_by(gene_id, sample) %>%
  summarise(count_avg = mean(count)) %>%
  ungroup()  %>%
  group_by(gene_id) %>%
  mutate(z_score = (count_avg-mean(count_avg))/sd(count_avg)) %>%
  ungroup()

# wide df will be used later for moving average
cnt_avg <- tidyr::pivot_wider(cnt_long_avg,
                              names_from = sample,
                              values_from = z_score,
                              id_cols = gene_id)


cnt_avg <- as.data.frame(cnt_avg)
rownames(cnt_avg) <- cnt_avg$gene_id
cnt_avg <- cnt_avg %>%
  dplyr::select(-gene_id)
8.5 Moving averages
# adding segments from population segmentation information
mdamb231_bulk_cna_id <- mdamb231_sc_bulk_cna_popseg %>%
  mutate(seg_index = 1:nrow(mdamb231_sc_bulk_cna_popseg))

# clustering information
cl_info <- mdamb231_bulk_cl_info %>%
  mutate(sample =str_remove(cells, "gDNA"),
         sample = str_extract(sample, "MDAMB231C[0-9]+"))

seg_ids_long <- rep.int(mdamb231_bulk_cna_id$seg_index, mdamb231_sc_bulk_cna_popseg$n.probes)

# bulk integer df
mdamb231_bulk_cna_long_int <- ploidy_scale(ploidy_VAL = 2.41,
                                           df = mdamb231_bulk_ordered)

rownames(mdamb231_bulk_cna_long_int) <- str_remove(rownames(mdamb231_bulk_cna_long_int), "gDNA") %>%
  str_remove("_S[0-9]+")

blk_long <- as.data.frame(t(mdamb231_bulk_cna_long_int))

# adding pipeline information
blk_long$chr <- bins_in_cna_pipeline$chr[1:nrow(blk_long)]
blk_long$start <- bins_in_cna_pipeline$start[1:nrow(blk_long)]
blk_long$end <- bins_in_cna_pipeline$end[1:nrow(blk_long)]
blk_long$abspos <- bins_in_cna_pipeline$abspos[1:nrow(blk_long)]
blk_long$seg_index <- seg_ids_long

# creating a long file with a position vector according to the number of rows
blk_long_g <- blk_long %>%
  mutate(pos = 1:nrow(blk_long)) %>%
  gather(key = "sample",
         value = "cn",
         -c(chr, start, end, abspos, pos, seg_index))

# obataining gene positions Grange
txdb <- Homo.sapiens

hg19_genes <- GenomicFeatures::genes(txdb, columns = "SYMBOL")
hg19_genes_df <- as.data.frame(hg19_genes) %>%
  mutate(SYMBOL = as.character(SYMBOL))

bins_gr <- bins_in_cna_pipeline  %>%
  makeGRangesFromDataFrame(keep.extra.columns = T, ignore.strand = T)

olaps <- findOverlaps(hg19_genes, bins_gr)

# finding which index (bin in the 200kb pipeline the gene is located)
# saving to a data frame
mk_df <- tibble(gene = hg19_genes_df$SYMBOL[queryHits(olaps)],
                pos = subjectHits(olaps)) %>%
  dplyr::distinct(gene, .keep_all = TRUE)

mk_df_j <- inner_join(mk_df, bms_df)

# all triplicates in long form
cnt_long_trip <- cnt %>%
  as.data.frame() %>%
  tibble::rownames_to_column("gene_id") %>%
  tidyr::gather(key = "sample_trip",
                value = "count",
                -gene_id) %>%
  mutate(sample= str_remove(sample_trip, "[A-C]$"))

cnt_long_all_zc <- cnt_long_trip %>%
  group_by(gene_id) %>%
  mutate(z_score = (count-mean(count))/sd(count)) %>%
  ungroup()

cnt_long_gene_trip <- inner_join(cnt_long_all_zc, mk_df_j)

cnt_long_gene_trip <- inner_join(cnt_long_gene_trip, cl_info) %>%
  arrange(chr, start_position)

# joining the copy number long data with the gene positions on their respective bins
blk_long_gj <- inner_join(blk_long_g, mk_df)

# adding the ensembl gene id information and the cluster information
blk_long_gj <- inner_join(blk_long_gj, bms_df) %>%
  arrange(pos) %>%
  left_join(cl_info)

# full dna rna table with counts merged by sample and ensemblgene_id
dna_rna <- inner_join(blk_long_gj,
                      cnt_long_avg)


# jitter to be able to visualize all the copy number tracks
jitter <- seq(-0.14, 0.17, 0.03)

cls <- gtools::mixedsort(unique(levels(droplevels(as.factor(blk_long_gj$subclones)))))

blk_long_gj_jit <- blk_long_gj %>%
  mutate(cn = case_when(
    subclones == cls[1] ~ cn + jitter[1],
    subclones == cls[2] ~ cn + jitter[2],
    subclones == cls[3] ~ cn + jitter[3],
    subclones == cls[4] ~ cn + jitter[4],
    subclones == cls[5] ~ cn + jitter[5],
    subclones == cls[6] ~ cn + jitter[6],
    subclones == cls[7] ~ cn + jitter[7],
    subclones == cls[8] ~ cn + jitter[8],
    subclones == cls[9] ~ cn + jitter[9],
    subclones == cls[10] ~ cn + jitter[10]
  ))

plot_moving_average(chr = "chr19",
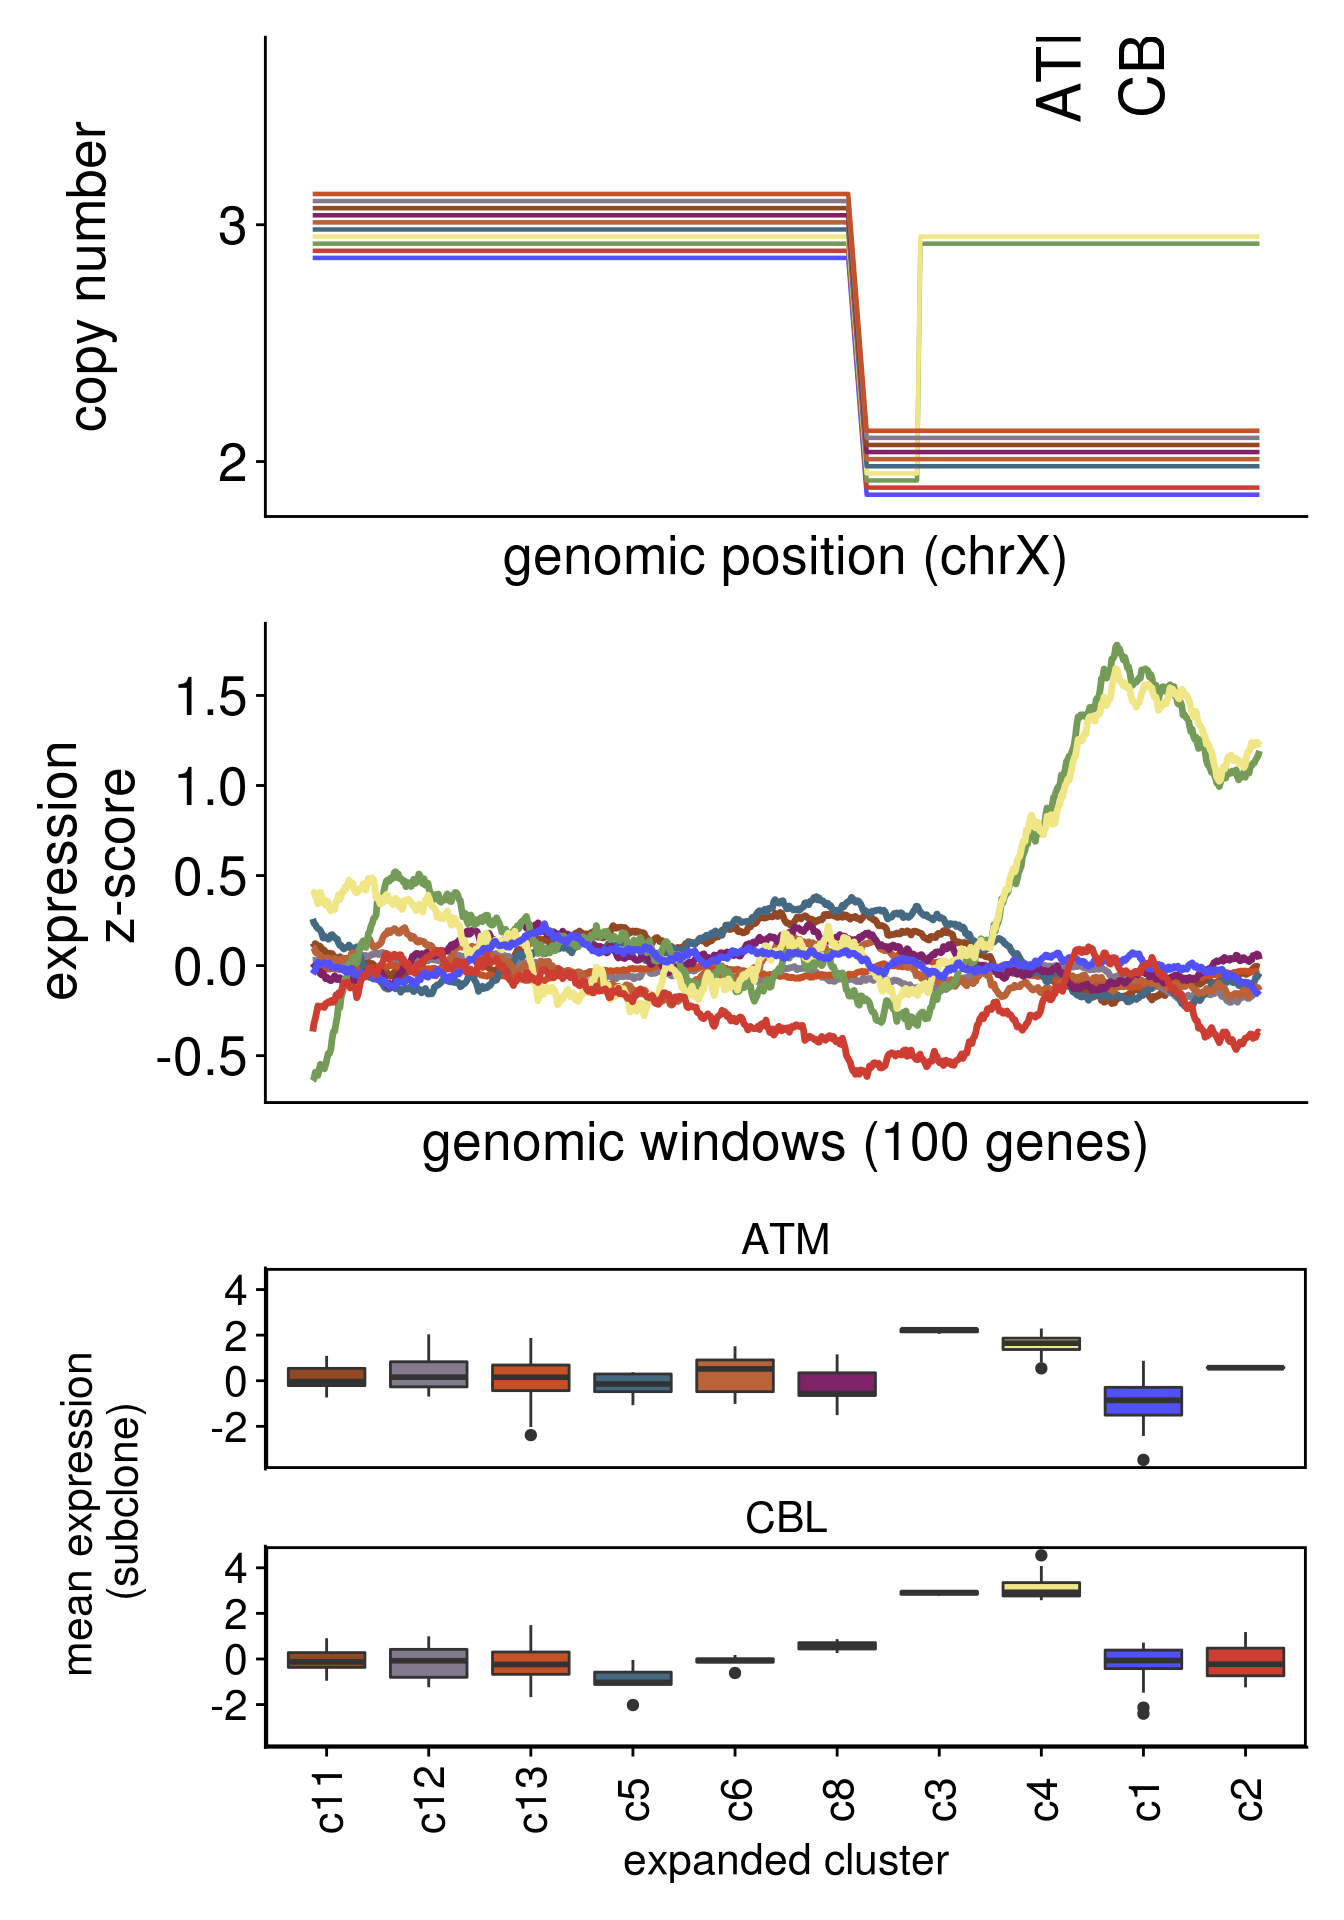
                    genes = c("SH3GL1","PIK3R2"))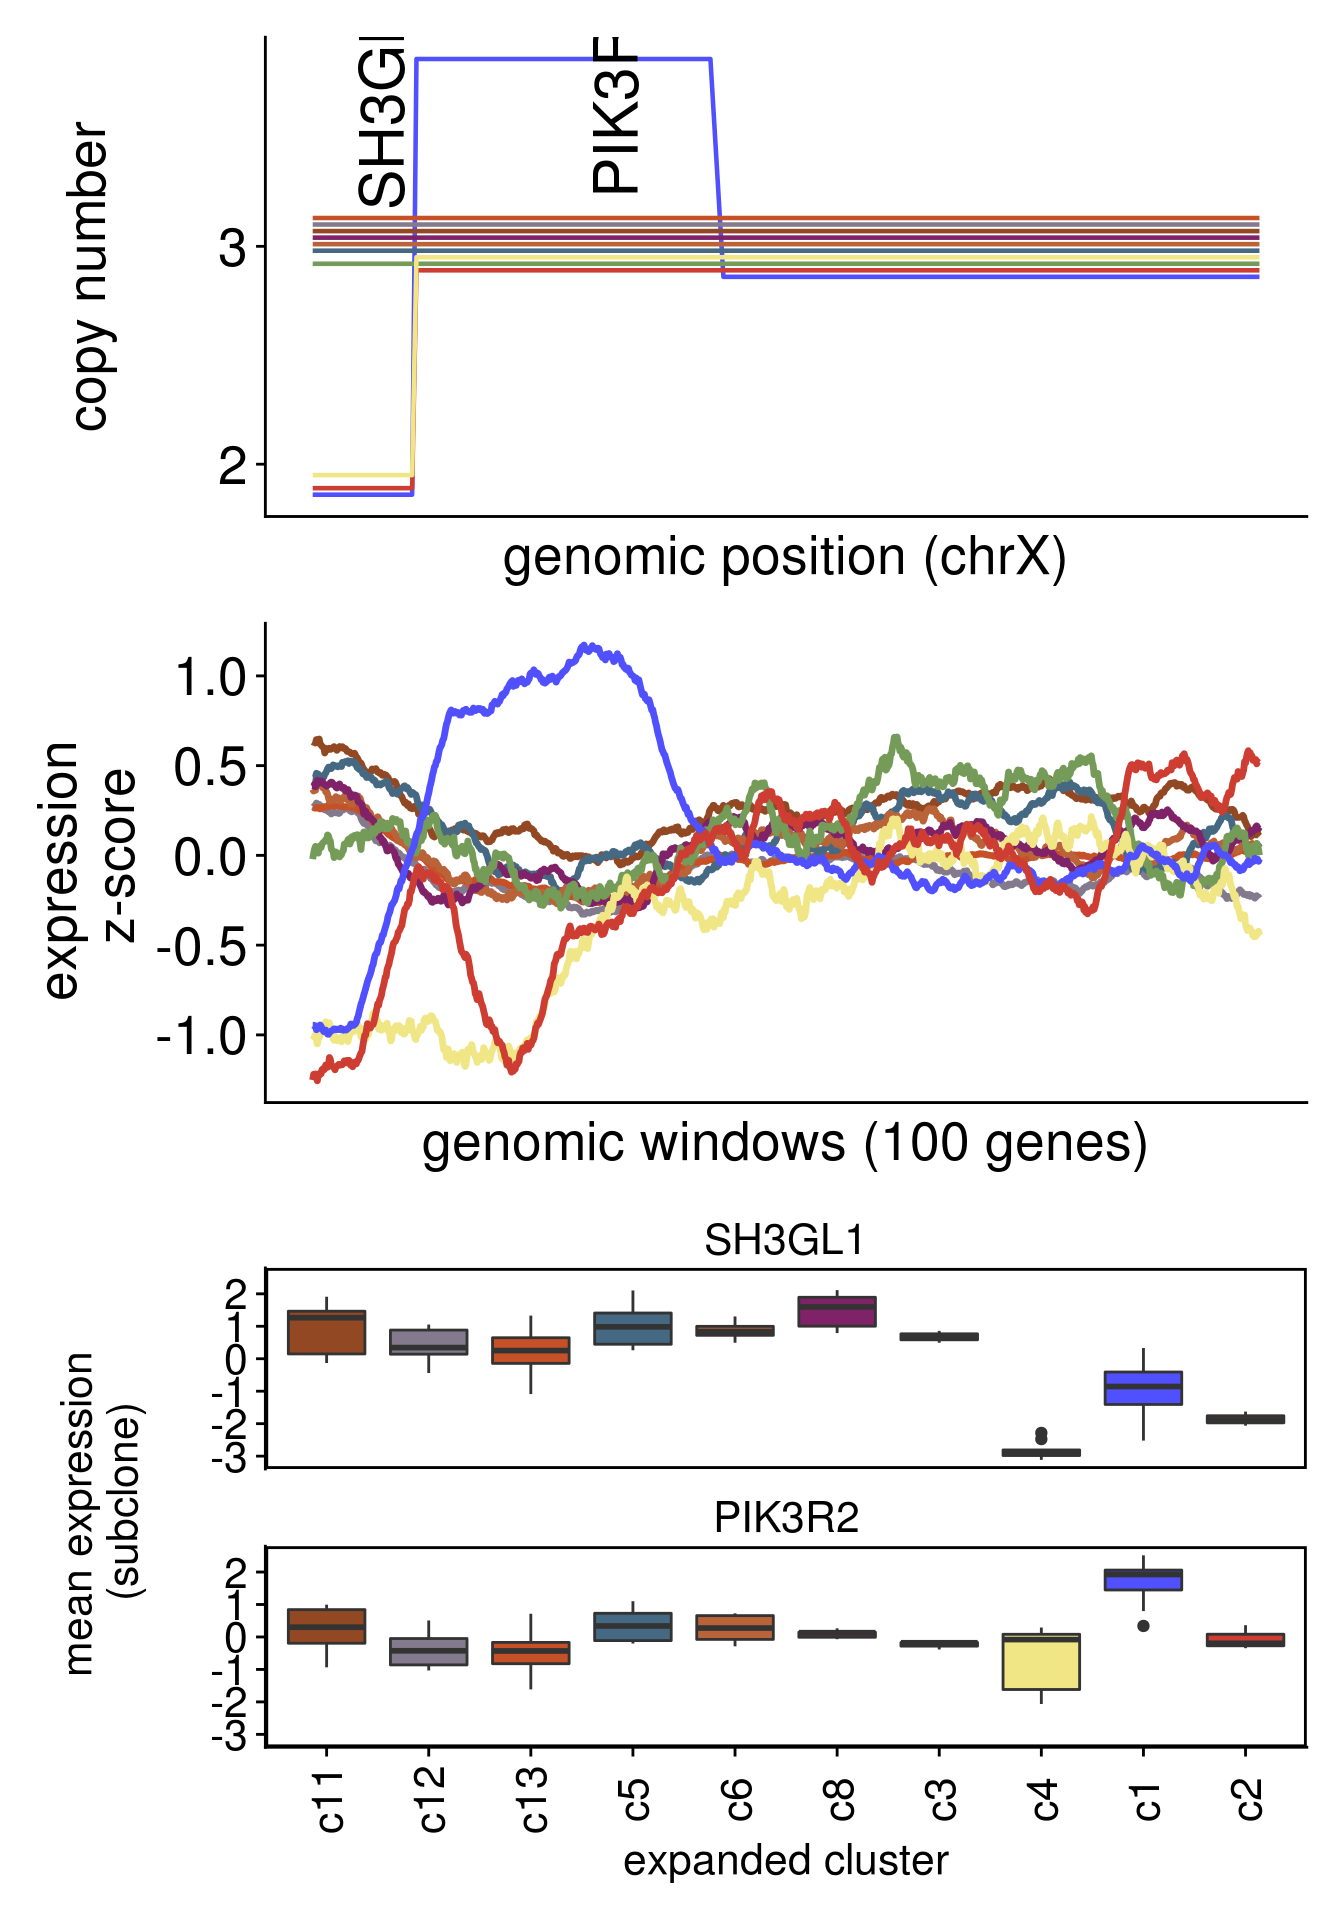
8.6 DE
samples <- as.data.frame(colData(dds)) %>%
  mutate(sample_name = str_extract(sample, "MDAMB231C[0-9]+"))

samples_cl <- left_join(samples, cl_info, by = c("sample_name" = "sample"))
#sanity check
samples_cl <- samples_cl[match(samples_cl$sample, colData(dds)$sample),]

# removing unused levels
colData(dds)$cluster <- droplevels(as.factor(samples_cl$subclones))

design(dds) <- formula(~ cluster)
register(BatchtoolsParam(workers = 60), default = TRUE)
dds <- DESeq(dds, parallel = TRUE, betaPrior = T)
## using pre-existing normalization factors## estimating dispersions## gene-wise dispersion estimates: 60 workers## mean-dispersion relationship## final dispersion estimates, MLE betas: 60 workers## fitting model and testing: 60 workers## -- replacing outliers and refitting for 7 genes
## -- DESeq argument 'minReplicatesForReplace' = 7
## -- original counts are preserved in counts(dds)## estimating dispersions## fitting model and testing## [1] "Intercept" "clusterc11" "clusterc12" "clusterc13" "clusterc5" "clusterc6" "clusterc8" "clusterc3" "clusterc4"
## [10] "clusterc1" "clusterc2"8.7 RNA PCA
pcaData <- plotPCA(vst(dds), "cluster", returnData = T) %>%
  mutate(triplicate = str_extract(name, "C[0-9]+"),
         triplicate = tolower(triplicate)) %>%
  mutate(sample = str_extract(name, "MDAMB231C[0-9]+"))
percentVar <- round(100 * attr(pcaData, "percentVar"))

cluster_anno <- mdamb231_sc_bulk_clustering %>%
  filter(str_detect(cells, "gDNA")) %>%
  mutate(sample = str_remove(cells, "gDNA")) %>%
  mutate(sample = str_extract(sample, "MDAMB231C[0-9]+"))

pcaData <- pcaData %>%
  left_join(cluster_anno, by = c("group" = "subclones",
                                 "sample" = "sample"))

p_pca <- ggplot(pcaData, aes(x = PC1,
                             y = PC2)) +
  scale_color_manual(values = c(colors_vector$subclones,
                                colors_vector$superclones)) +
  geom_point(aes(color = fct_relevel(superclones, gtools::mixedsort(unique(as.character(pcaData$superclones))))), size = 8) +
  geom_point(aes(color = fct_relevel(group, gtools::mixedsort(unique(as.character(pcaData$group))))), size = 3) +
  xlab("PC1") +
  ylab("PC2") +
  theme_cowplot() +
  theme(axis.title.x=element_text(size = 16),
        axis.text.x= element_blank(),
        axis.ticks.x=element_blank(),
        axis.title.y = element_text(size = 16),
        axis.text.y = element_blank(),
        axis.ticks.y = element_blank(),
        axis.line = element_blank(),
        plot.title = element_text(hjust = 0.5),
        legend.position = "none",
        panel.border = element_rect(color = "black",
                                    fill = NA,
                                    size = 2)) +
  labs(color = "subclone")

p_pca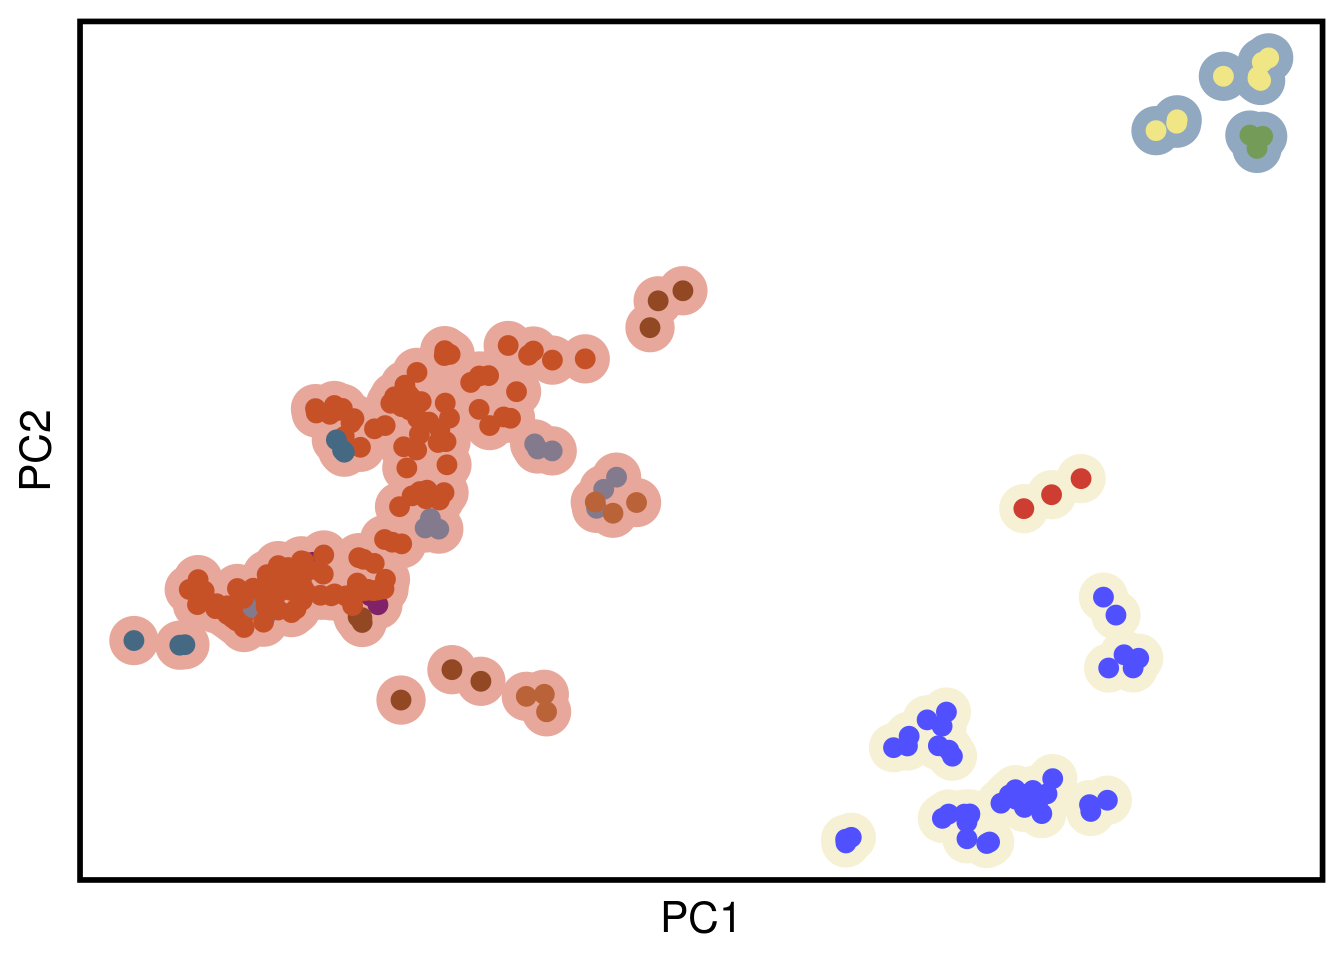
8.8 FGSEA
# Thanks to https://stephenturner.github.io/deseq-to-fgsea/

fgseaResTidy <- list()

for (x in 1:length(clusters)) {
  res <-
    results(dds,
            contrast = list(
              paste0("cluster", clusters[x]),
              paste0(
                "cluster",
                clusters[clusters %!in% clusters[x]]
              )
            ),
            listValues = c(1, -1 / 10))

  rownames(res) <- str_replace(rownames(res),
                               ".[0-9]+$", "")


  res$symbol <- mapIds(
    org.Hs.eg.db,
    keys = row.names(res),
    column = "SYMBOL",
    keytype = "ENSEMBL",
    multiVals = "first"
  )

  res$map <- mapIds(
    org.Hs.eg.db,
    keys = row.names(res),
    column = "MAP",
    keytype = "ENSEMBL",
    multiVals = "first"
  )
  head(res[order(res$padj), ], 20)

  res$gene_map <- paste0(res$symbol, " ", "(", res$map, ")")

  res <- drop_na(as.data.frame(res))

  res2_de <- res %>%
    as_tibble() %>%
    dplyr::select(symbol,
                  stat) %>%
    na.omit() %>%
    distinct() %>%
    group_by(symbol) %>%
    summarize(stat = mean(stat))

  ranks_de <- deframe(res2_de)

  pathways.hallmark <-
    gmtPathways(
      here("extdata/lib/h.all.v6.2.symbols.gmt")
    )

  fgseaRes <-
    fgsea(pathways = pathways.hallmark,
          stats = ranks_de,
          nperm = 2000)

  fgseaResTidy[[x]] <- fgseaRes %>%
    as_tibble()

  names(fgseaResTidy)[x] <- clusters[x]


}

fgseaResTidy_res <- bind_rows(fgseaResTidy, .id = "comparison")

# keeping only the significant pathways in x or more hallmarks
sig_path <- fgseaResTidy_res %>%
  filter(padj < 0.05) %>%
  group_by(pathway) %>%
  dplyr::count() %>%
  arrange(desc(n)) %>%
  filter(n > 3) %>%
  pull(pathway)


fgseaResTidy_res_f <- fgseaResTidy_res %>%
  filter(pathway %in% sig_path) %>%
  mutate(pathway = str_remove(pathway, "HALLMARK_")) %>%
  mutate(pathway = str_replace_all(pathway, "_", " ")) %>%
  mutate(pathway = str_to_lower(pathway))  %>%
  mutate(comparison = paste0("e", comparison))

fg_cl <- pivot_wider(
  fgseaResTidy_res_f,
  names_from = pathway,
  values_from = NES,
  id_cols = comparison
) %>%
  as.data.frame()

rownames(fg_cl) <- fg_cl[, 1]

fg_cl_hclust <- hclust(dist(fg_cl[, -1],
                            method = "euclidean"),
                       method = "ward.D")


fg_path <- pivot_wider(
  fgseaResTidy_res_f,
  names_from =
    comparison,
  values_from = NES,
  id_cols = pathway
) %>%
  as.data.frame()

rownames(fg_path) <- fg_path[, 1]

fg_path_hclust <- hclust(dist(fg_path[, -1],
                              method = "euclidean"),
                         method = "ward.D")


# thanks to https://mgrcbioinfo.github.io/my_GSEA_plot/

myGseaPlot <- function(gseaDataFrame, adjPCutoff = 0.05) {
  # subset data frame using p value cutoff and add status factor
  toPlot <- subset(gseaDataFrame, padj <= adjPCutoff) %>%
    mutate(status = case_when(NES > 0 ~ "Up", NES < 0 ~ "Down")) %>%
    mutate(status = factor(status, levels = c("Up", "Down")))

  # create plot
  p <-
    ggplot(
      data = toPlot,
      mapping = aes(
        x = fct_relevel(comparison,
                        rownames(fg_cl)[fg_cl_hclust$order]),
        y = fct_relevel(pathway,
                        rownames(fg_path)[fg_path_hclust$order]),
        color = status,
        shape = status,
        fill = NES,
        size = -log10(padj)
      )
    ) +
    geom_point() +
    scale_shape_manual(values = c(24, 25)) +
    scale_fill_gradient2(
      high = "firebrick3",
      low = "deepskyblue3",
      mid = "white",
      midpoint = 0
    ) +
    scale_color_manual(values = c(Up = "coral3", Down = "deepskyblue3")) +
    ggtitle(paste0("GSEA")) +
    theme_bw() +
    theme(
      plot.title = element_text(hjust = 0.5, size = 18),
      axis.title.x = element_text(size = 16),
      panel.grid = element_blank(),
      legend.position = "bottom",
      axis.text.x = element_text(
        angle = 90,
        hjust = 1,
        size = 16,
        vjust = .5
      ),
      axis.text.y = element_text(size = 14)
    ) +
    ylab("") +
    xlab("expanded clusters")

  return(p)
}

hallmarks_plot <-
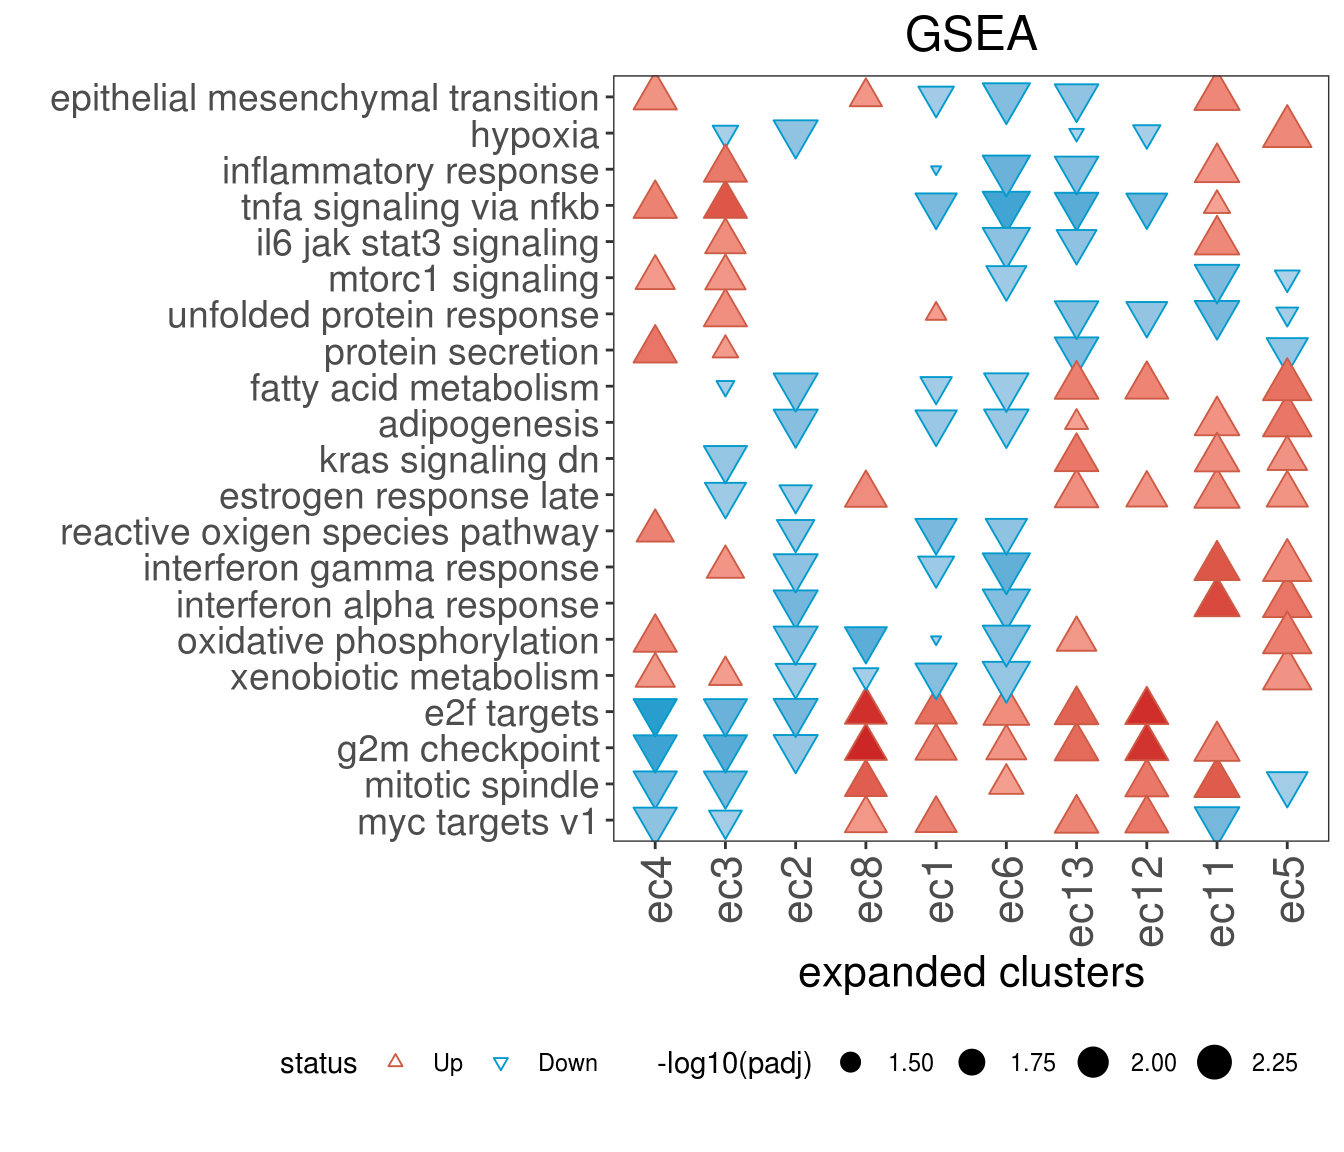
  myGseaPlot(gseaDataFrame = fgseaResTidy_res_f, adjPCutoff = 0.05)

hallmarks_plot